SpatialSVG – Generating Styled SVGs from GeoJSON, KML or GPX

- Published on
- Duration
- 3 Days
- Role
- GIS Developer
- Price
- Free
- Category
- File Converter
Convert GeoJSON, KML, and GPX to Styled SVGs with spatial-to-svg
Geospatial data is everywhere — from maps and sensors to transport networks and location-based services. But what if you could easily convert these spatial files into beautifully styled SVG visuals? Whether you're a developer building custom maps or a designer preparing vector outputs for printing, you’ll love this new tool.
Let me introduce spatial-to-svg, a flexible JavaScript library that transforms your GeoJSON, KML, and GPX files into scalable vector graphics (SVG) — with support for powerful styling rules.
Try it Live:
Visit the DEMO page for an interactive preview.
Watch the Tutorial: YouTube video here
Installation
npm install spatial-to-svg
Live Demo
This library is integrated into the GISLayer Editor.
Once logged in, navigate to the Data menu, upload your geometry to the map, and use the SVG Export feature.
Note: You can use the tool for free for 30 minutes.
Quick Start
Let’s say you have a GeoJSON file and want to convert it into an SVG.
import SpatialSVG from "spatial-to-svg";
import * as fs from "fs";

const geojson = fs.readFileSync("./data.geojson", "utf8");

const svgConverter = new SpatialSVG({
  fileType: "geojson",
  data: geojson,
  size: 1000,
  styleType: "general",
  styles: {
    stroke: "#FF0000",
    strokeWidth: 2,
    fill: "#00FF00",
    fillOpacity: 0.5,
    radius: 10,
  },
});

const svg = svgConverter.getSVG();
fs.writeFileSync("./output.svg", svg);
Supported File Types
You can convert these formats simply by changing the fileType:
- GeoJSON:
fileType: "geojson" - KML:
fileType: "kml" - GPX:
fileType: "gpx"
All conversion examples follow the same structure as shown above — just replace the file and
fileType.
Configuration Options
| Option | Description |
|---|---|
fileType | Type of input file. Accepts "geojson", "kml", or "gpx" |
data | The full string content of your file |
size | Sets the longer edge of the SVG canvas. The other edge is calculated from BBOX |
styleType | Controls how styles are applied: general, geotype, property, or filter |
styles | Style definitions, varying by styleType |
Styling Options
You can style your geometries in several ways. Here’s a breakdown:
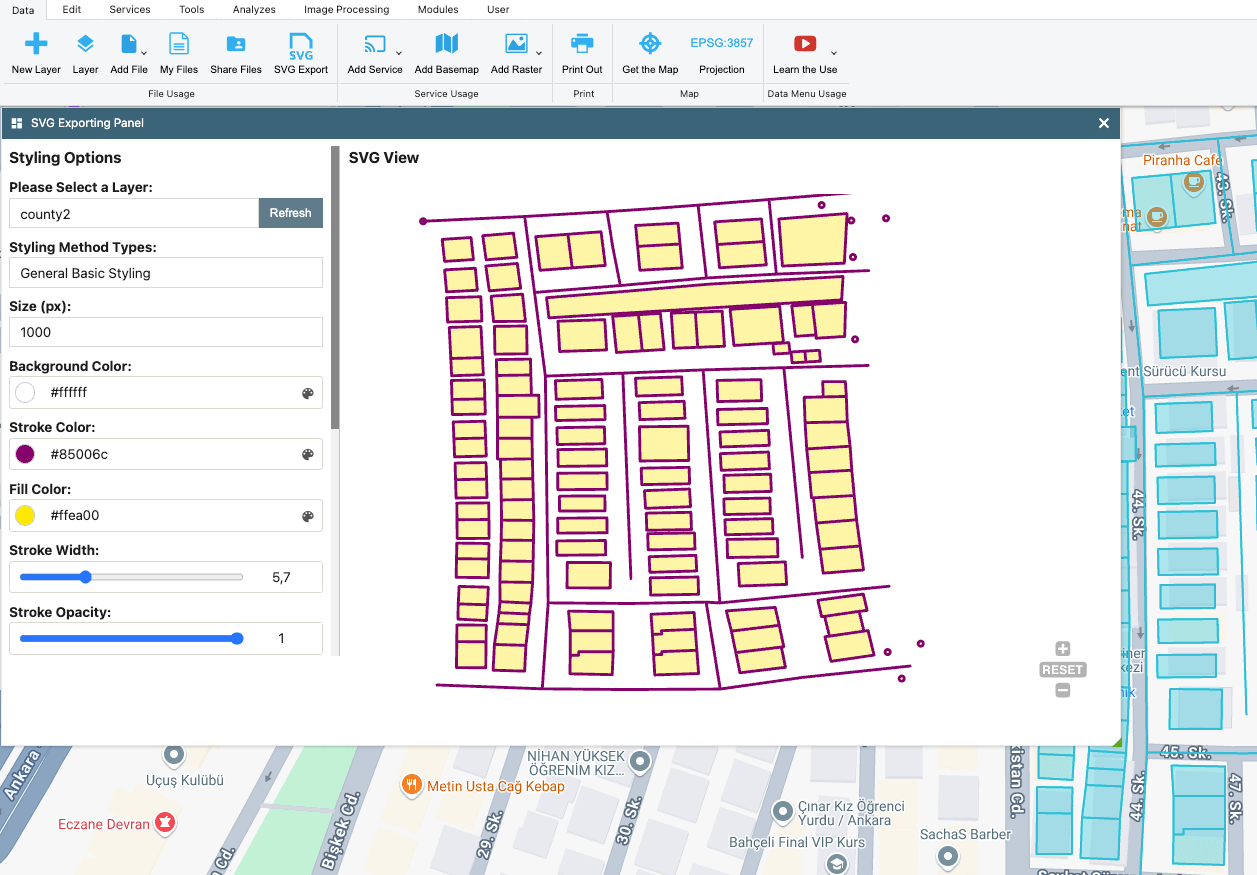
1. General Styling
Applies one style to all geometries:
styles: {
  stroke: "#FF0000",
  strokeWidth: 2,
  fill: "#00FF00",
  fillOpacity: 0.5,
  radius: 10,
}
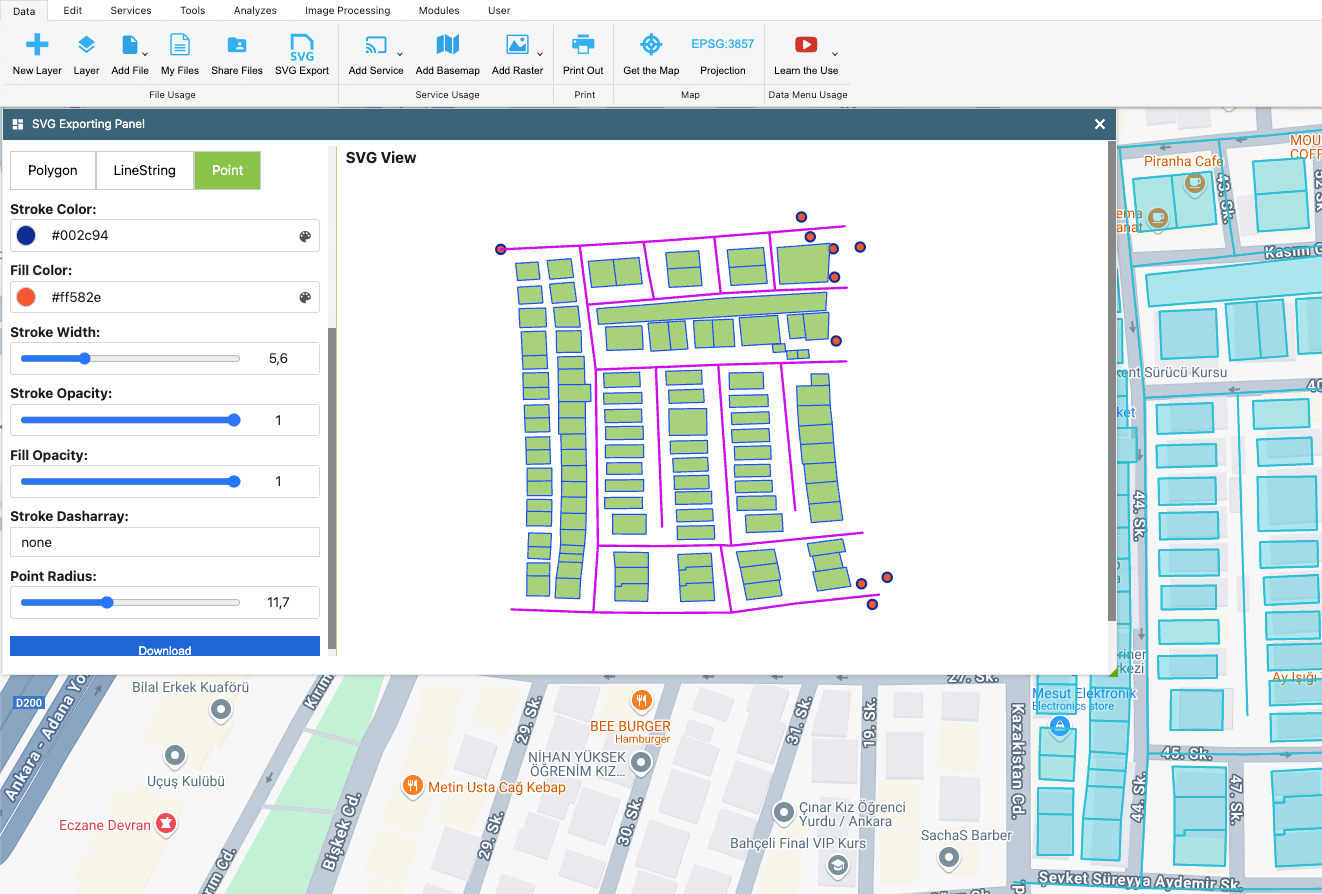
2. Style by Geometry Type
Assign different styles for Point, LineString, and Polygon:
styles: {
  Point: {
    radius: 6,
    fill: "#00f",
  },
  LineString: {
    stroke: "#000",
    strokeWidth: 1,
  },
  Polygon: {
    stroke: "#999",
    fill: "#ccc",
    fillOpacity: 0.6,
  }
}
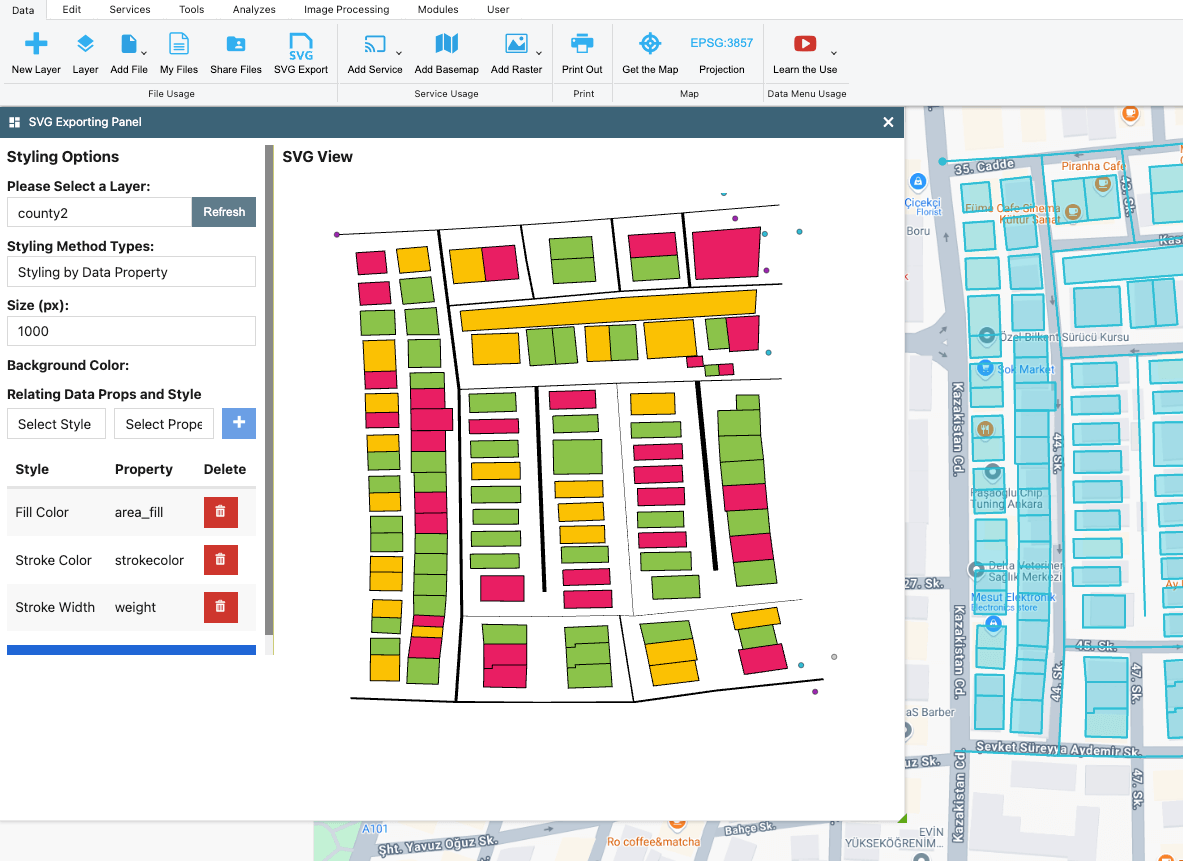
3. Style by Properties
Use property keys in your GeoJSON to drive styling:
styles: {
  props: {
    stroke: "border_color",
    fill: "fill_color",
    fillOpacity: "opacity_value"
  }
}
This reads values from each feature’s properties block.
4. Filter-Based Styling
Define condition-based filters. Here’s an example that styles buildings based on height:
styles: {
  filters: [
    {
      conditions: [
        { property: "height", operator: ">=", value: 10 },
        { property: "height", operator: "<", value: 30 }
      ],
      style: { fill: "#00FF00", fillOpacity: 1 }
    },
    {
      conditions: [
        { property: "height", operator: ">=", value: 30 },
        { property: "height", operator: "<", value: 100 }
      ],
      style: { fill: "#FFA500", fillOpacity: 1 }
    },
    {
      conditions: [
        { property: "height", operator: ">=", value: 100 },
        { property: "height", operator: "<", value: 200 }
      ],
      style: { fill: "#FF0000", fillOpacity: 1 }
    }
  ]
}
Supported Filter Operators
| Operator | Description |
|---|---|
> | Greater than |
< | Less than |
>= | Greater than or equal |
<= | Less than or equal |
== | Equal to |
!= | Not equal to |
in | Value is in list |
not in | Value is not in list |
like | Contains substring |
not like | Does not contain substring |
is null | Property is null or not present |
is not null | Property is present and not null |
Why Use SVG?
- Scalable and resolution-independent
- Easily styled for maps, dashboards, or print
- Can be embedded into websites, PDFs, or design tools
- Small file sizes with vector precision
About the Author
Ali Kılıç
Full-stack GIS Developer & Founder at GISLayer
Personal Site
LinkedIn Profile
Feel free to try it, fork it, or reach out with ideas and feedback.
Happy mapping!