Helper POI Data For Earthquake Survivors and Tweet Locations of Victims

- Published on
- Duration
- 3 Days
- Role
- Development
- Devices
- Web
- Category
- Aid Work


Online Web Site
Click and Go To Site : https://deprem.gislayer.com/
Why I developed this software?
On February 6, 2023, two consecutive earthquakes with magnitudes of 7.8 and 7.5 struck the southern region of Turkey within a 9-hour interval. The first day following the earthquake was marked by chaos and uncertainty. We noticed that some individuals trapped under debris were sending tweets with their locations using their mobile phones. By identifying the locations from these tweets, we were able to relay the information, including the names of the individuals, to the Ministry of Environment and Urban Planning.
The first eight days following the earthquake were crucial, and I hope that the data we provided to the relief teams through this software proved to be effective. If even one person's life was saved through this software, I consider it a great success.
What I could do for those trapped under debris in the earthquake was limited. After this situation, it became crucial for us to explain how aid was reaching people. For this purpose, with a team of 20 people, we marked locations where services such as healthcare, clothing, food, shelter, accommodation, and internet were provided.
Approximately 230,000 people accessed this system. I practically didn't sleep for about three days and developed this software. It wouldn't be fitting for me to sleep while people were taking their last breaths there.
Furthermore, people could enter information about missing persons through this software. We forwarded this information to the relevant government agencies. Therefore, this system carries emotional scars for me.
Technologies Employed
To quickly develop this software, I utilized OpenLayers, Turf.js, and Vue.js. Since I used the API services of GISLayer, we recorded registration processes and geometric information under GISLayer.
Front-End Technologies
- HTML5 + CSS + Javascript
- VueJS
- Openlayers, Turfjs
Back-End Technologies
- NodeJS
- Express
- Sequelize
Database Technologies
- Postgre SQL Postgis
- LocalStorage
- SQL Lite
Recent Earthquakes
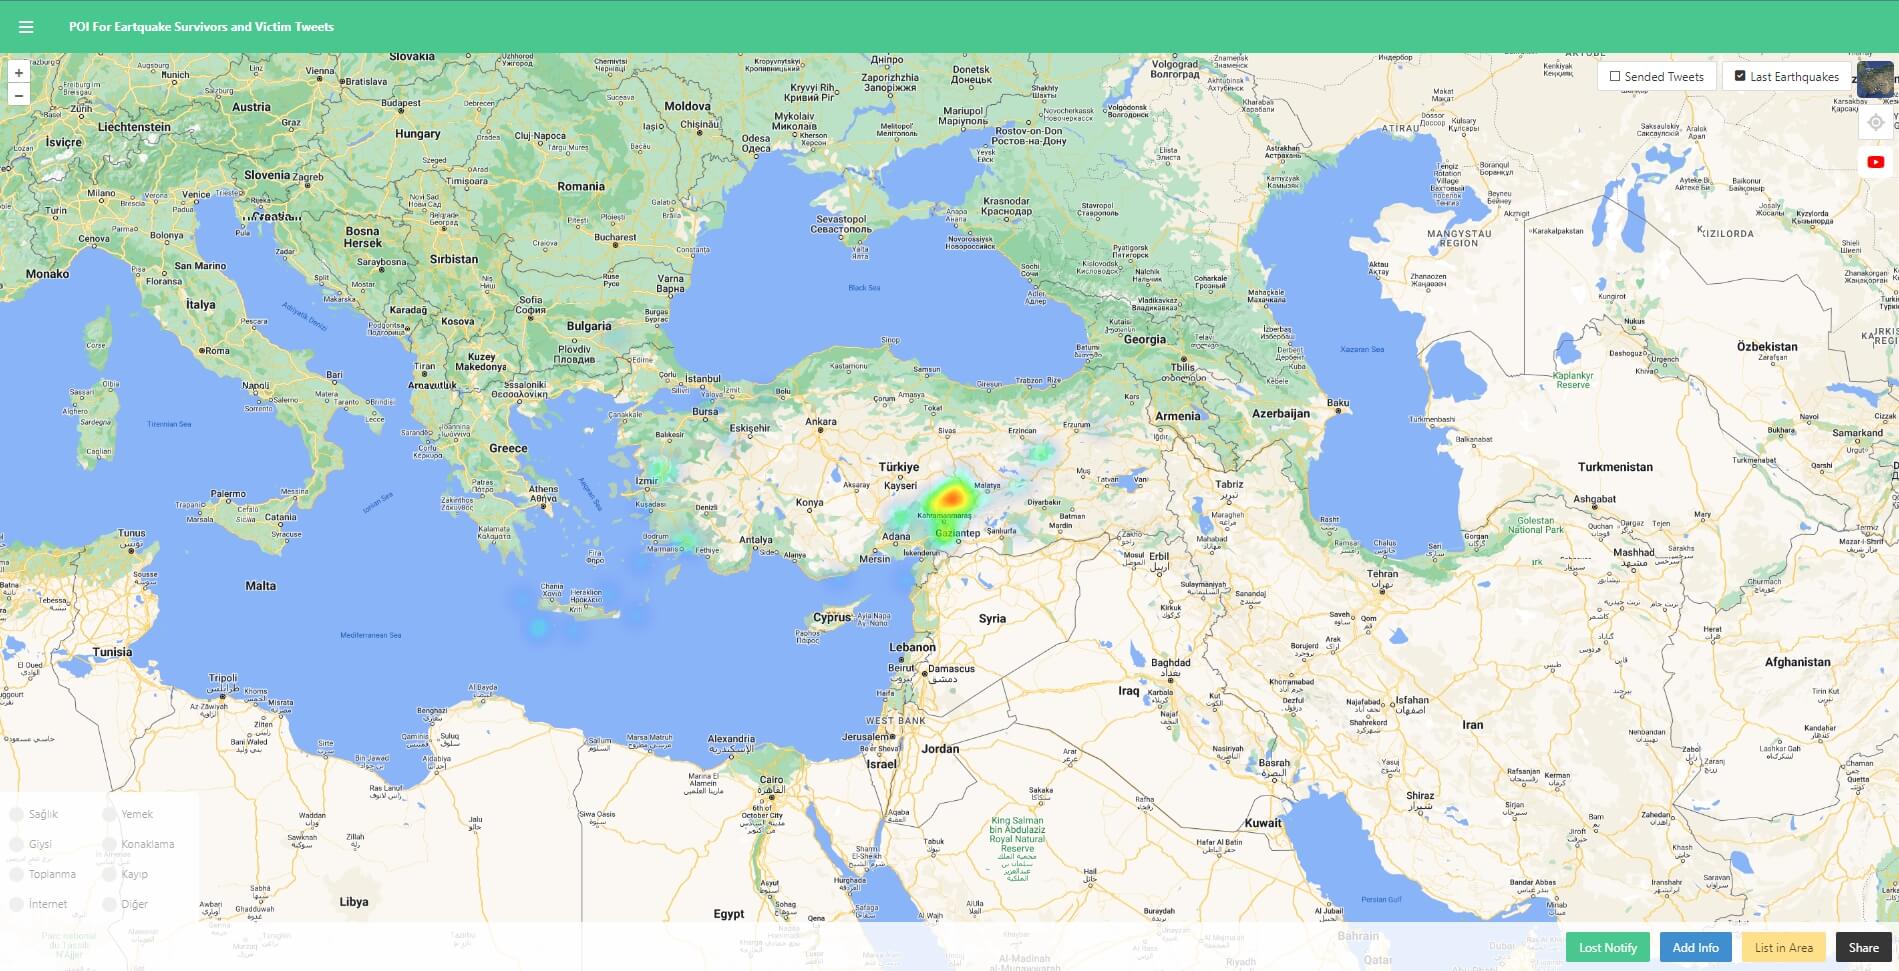
Point data of the latest earthquakes, obtained in real-time from the Kandilli Observatory, has been subjected to heatmap analysis based on the magnitude of the earthquakes.

- Recent earthquakes are displayed on the map.
- Points are color-coded based on the magnitude of the earthquake.
- Areas where earthquakes are concentrated are shown through heatmap analysis.
Location-Based Tweets
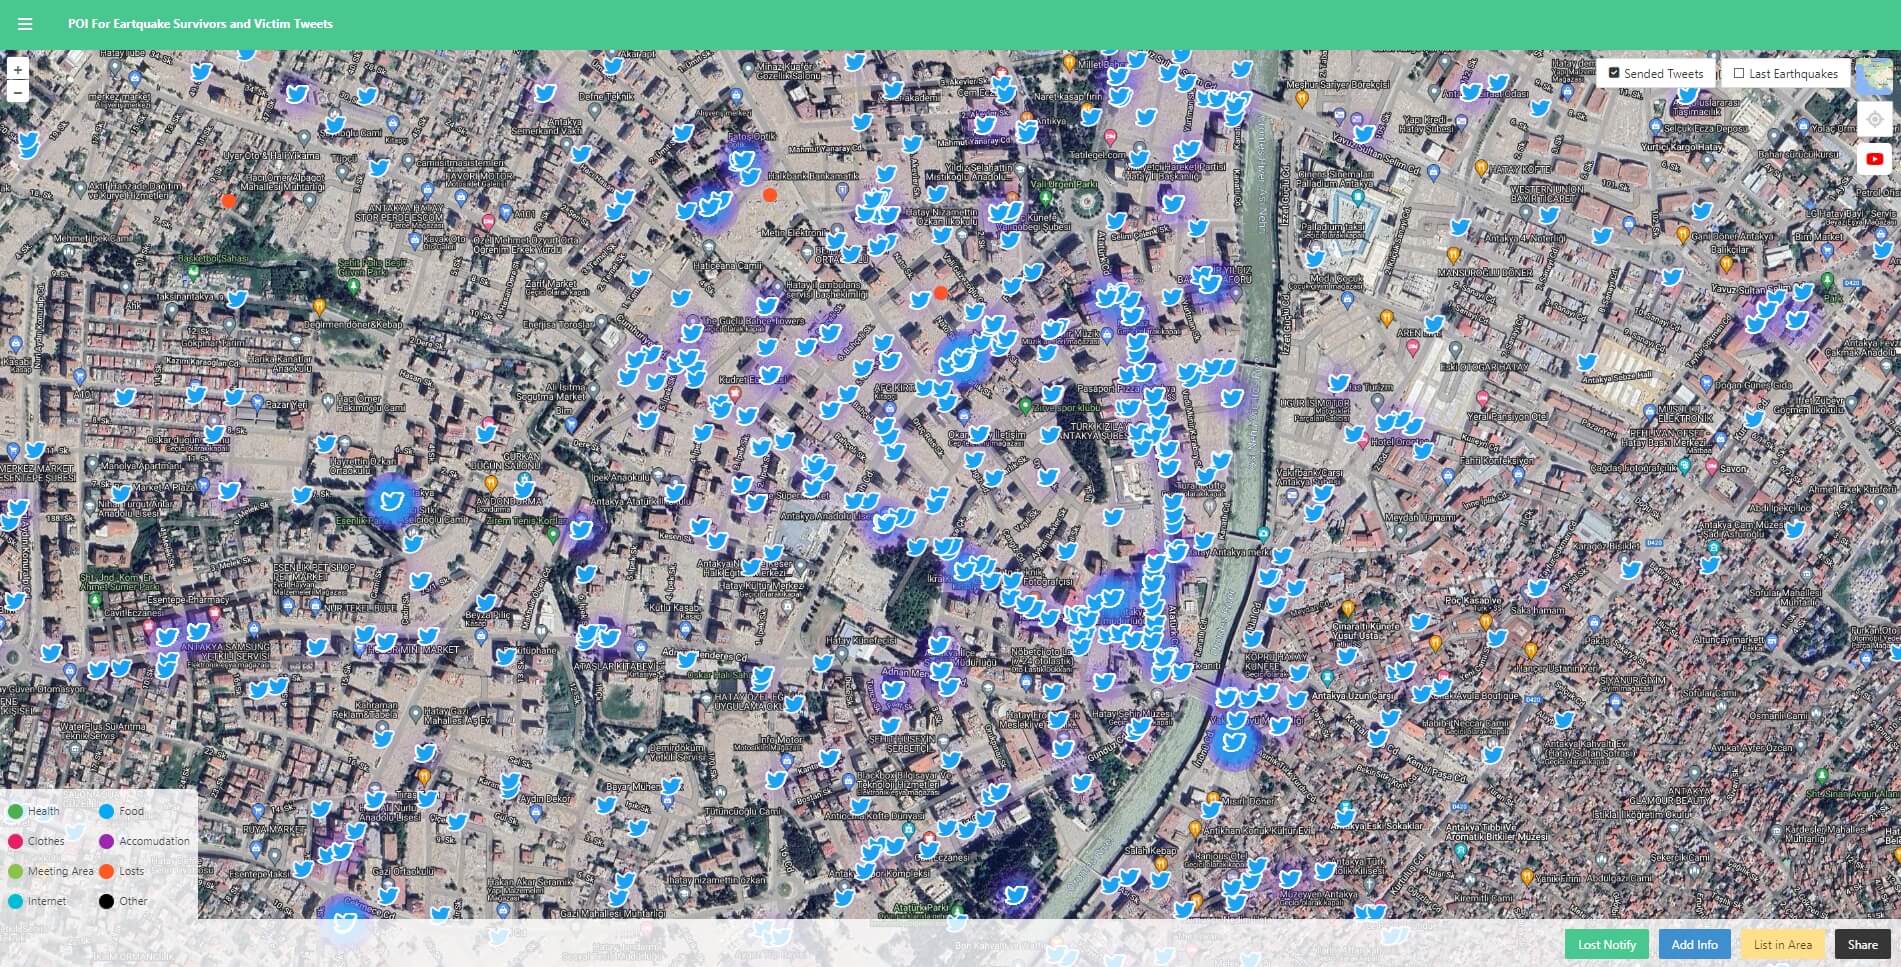
While some earthquake victims could send tweets from under the rubble, relatives of the victims were also tweeting from the debris, and all these tweets have locations. All collected tweets were provided to AFAD authorities, and you can read them by clicking through the system.

- Reading and Sharing Posted Tweets
- Forwarding Tweets to AFAD Teams
Points of Interest (POI)
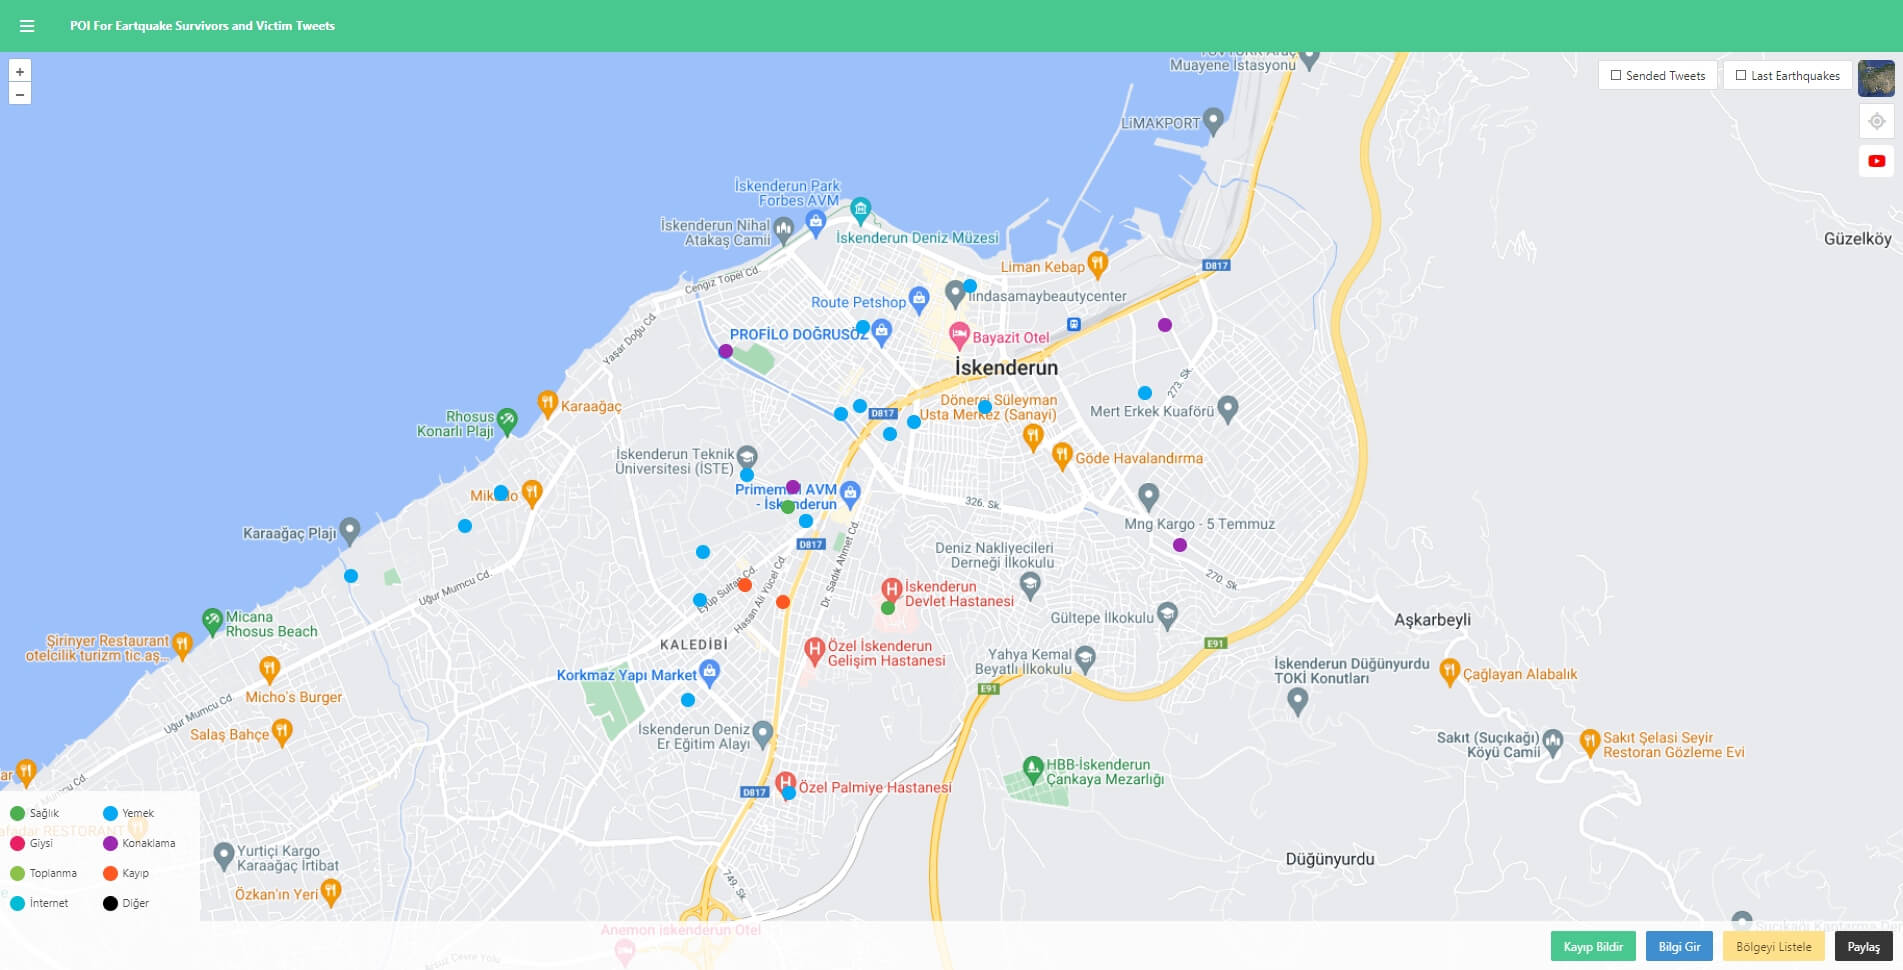
These colorful points are important for earthquake survivors.

- Points where Health Assistance is provided
- Points where Food Aid is provided
- Points where Clothing Assistance is provided
- Points where Accommodation Assistance is provided
- Points where Internet and Electricity Assistance is provided
- Other important points